Reading in Data
The first thing many Data Scientists need to do is to be able to read in our data. For that reason, today we discuss some of the basic ways of reading in data into our program.
Structure vs Non-Structured Data? Who cares!
In all Data Science and Machine Learning projects, data plays a key and central role. This can range from a collection of data points you have gathered for training your model, testing your model, or the actual data you have collected for making predictions.
Very quickly you will recognise that data can come in various forms and shapes. In addition you may hear people talking about structured vs unstructured data. Examples of structured data can be an address, postal code, first+last name,etc.. Most people think of data organised in tables whenever we talk about “structured data”. On the other hand, “unstructured data” are those forms of data that cannot be easily pictured as a “table”. Examples could be images, videos, or sound files.
In actual fact, this type of differentiation and classification is irrelevant. That is to say, the only thing that matters is understanding how to read in and process different types of data. Here we will discuss some of the Four common data formats you may encounter (CSV, Excel, Image, JSON).
Reading in Data – Comma Separated Value (.CSV)
CSV files are plain text data consisting of values separated/delimited by a comma. Because of its’ ease of use and creation, it has become a very common format. Practically anyone with Notepad (Windows) or Text Editor (Mac OS) can quickly whip of a simple CSV file.
Imagine you would like to build a simple Address book of your friends, and you would like to store their phone number of email addresses. Given these points, this could be achieved by creating a file like below
Addressbook.csv:
Name, Phone Number, Email Address
Albert Smith, +1-416-1234-5678, AlbertSmith@freedomvc.com
Beth Travis, +1-416-2345-6789, BethTravis@freedomvc.com
Charles Ulriges, +1-416-9876-5432, CharlesUlriges@freedomvc.com
Method 1 – Using Python CSV package
# Import the python CSV package
import csv

with open (‘addressbook.csv’, newline=‘’) as sourcefile:
    sourcereader = csv.reader(sourcefile, delimiter=',')
    for row in sourcereader:
        print(row)
Output:
['Name', ' Phone Number', ' Email Address']
['Albert Smith', ' +1-416-1234-5678', ' AlbertSmith@freedomvc.com']
['Beth Travis', ' +1-416-2345-6789', ' BethTravis@freedomvc.com']
['Charles Ulriges', ' +1-416-9876-5432', ' CharlesUlriges@freedomvc.com']
As shown above the code snippet prints each row of our csv file. Instead of printing on screen, you could easily append the data into a python list. Additional points to note:
- Notice in our For-loop as we iterate through our data, each “row” of data is returned as a Python List.
- When we use the “with open” command, Python helps us to automatically handle the opening and closing of files. This also helps to release needed resources during execution.
- As we build our sourcereader object, we chose “,” as our delimiter, this could easily be others as well (e.g. Tab separated value)
Method 2 – Using Pandas read_csv
Pandas is a common data processing tools used by Data Scientists and is supported by an active community. If you intend to be working with pandas DataFrames, then why not consider to directly read in your CSV as such.
# Import the python CSV package
import pandas as pd
Mydata = pd.read_csv("addressbook.csv")
Reading in data – Excel Spreadsheet (.xlsx)
Reading in data from an Excel spreadsheet is very similar to reading from a CSV File. Often times the data are stored in a tabular format. Instead of using the CSV package that came with Python, we will be using Pandas and XLRD. XLRD is a unicode aware library that assists in reading Excel files.
Before we run our code, we should make sure that both Pandas and XLRD is setup in our virtual environment. You can quickly check with the below commands.
% pip show pandas

Name: pandas
Version: 1.0.3
Summary: Powerful data structures for data analysis, time series, and statistics
Home-page:https://pandas.pydata.orgAuthor-email: None
License: BSD
Location: xxx/lib/python3.7/site-packages
Requires: python-dateutil, numpy, pytz
Required-by:

% pip show xlrd

Name: xlrd
Version: 1.2.0
Summary: Library for developers to extract data from Microsoft Excel (tm) spreadsheet files
Home-page: http://www.python-excel.org/
Author: John Machin
Author-email: sjmachin@lexicon.net
License: BSD
Location: /xxx/lib/python3.7/site-packages
Requires:
Required-by:
If you get a warning message informing you the package is not found, then please proceed to install the package(s) first. In particular, this can be done easily via PIP or Anaconda, or any other package manager you are comfortable with.
Addressbook.xlsx
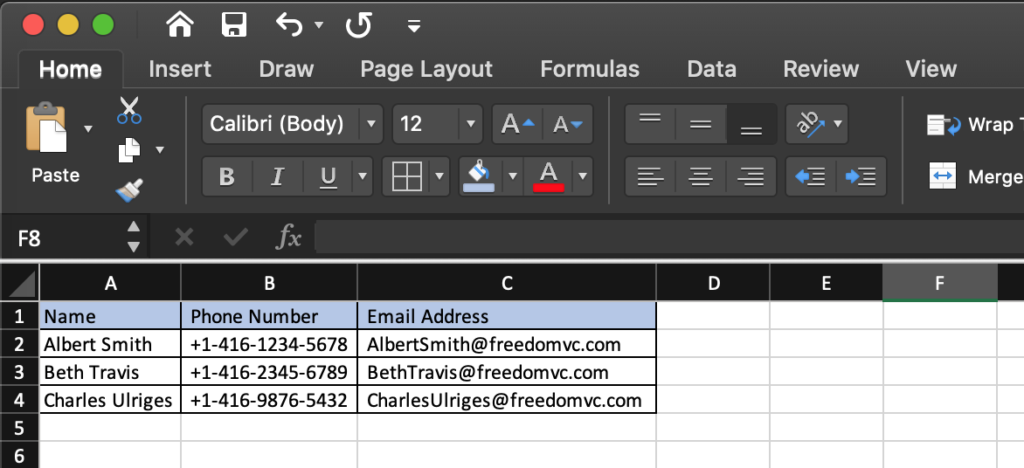
Imagine once again we have our address book, but this time saved as an Excel file

With a few quick lines of code, we first import our Pandas package. Next we use its’ built in function read_excel, and save the results into a variable “df”.
# Import pandas package and reference it as "pd" for short
import pandas as pd

df = pd.read_excel('addressbook.xlsx')
print(df)
              Name       Phone Number                  Email Address
0     Albert Smith   +1-416-1234-5678      AlbertSmith@freedomvc.com
1      Beth Travis   +1-416-2345-6789       BethTravis@freedomvc.com
2  Charles Ulriges   +1-416-9876-5432   CharlesUlriges@freedomvc.com
Reading in data – Images (i.e. .JPG)
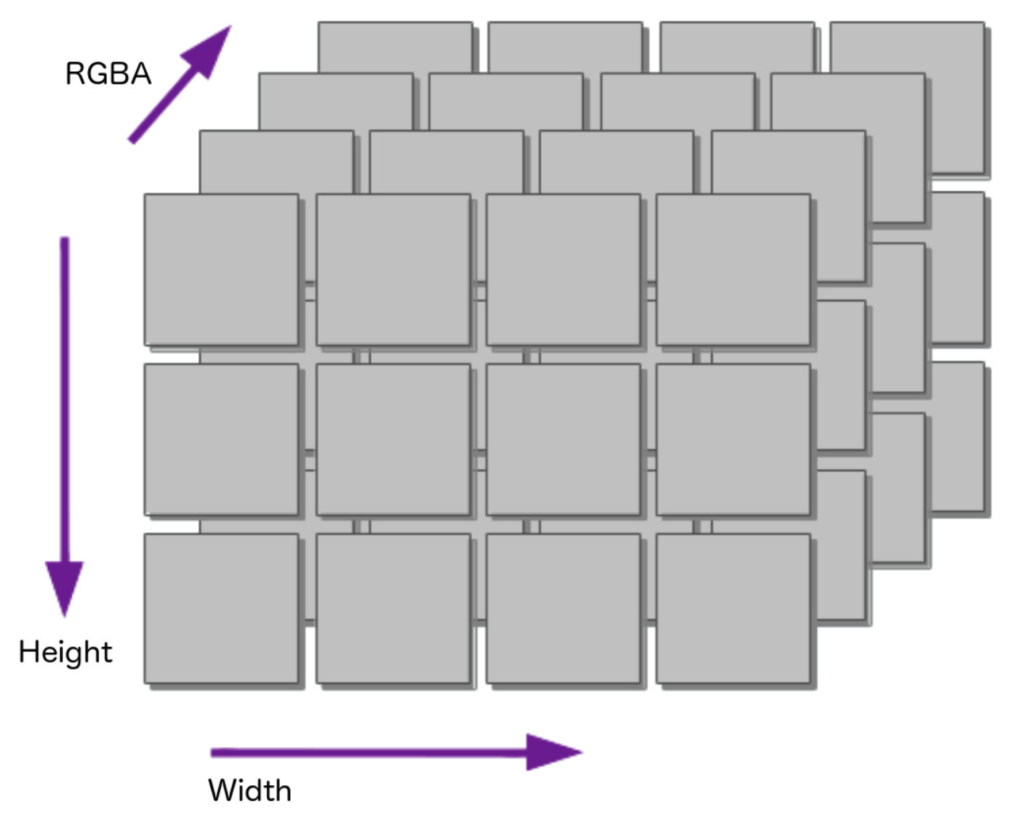
Once you realise most images can be represented in a computer as a 3-dimensional matrix, reading images into Python becomes easy. As an illustration, we take an image to briefly explain the concept.

Imagine the width and height of the picture makes up a 2D matrix. Subsequently the last dimension(s) indicate the colour as specified as a numerical value for each pixel. The third dimension may vary depending on the col
our space of the image. In the case of black and white images, the third dimension is only one layer. In contrast, coloured photos in the RGB colour space can have 3-4 layers indicated by Red, Green, Blue (RGB) values. Additionally an Alpha (A) layer representing the transparency may be present.


Food.JPG
There are several ways to read images into Python. As an illustration we describe one of the simplest ways with Numpy and PIL (Python Image Library). Again, check whether you have these packages installed, if not, we recommend to setup them up in your virtual environment.
# Import necessary libraries
import numpy as np
from PIL import Image

# Read our image and convert into a Numpy Array
img = Image.open('Food.JPG')
array = np.array(img)

# Print the size of our image
print(array.shape)
Print(array)
Upon executing the above code, you should get output as illustrated below. The first set of numbers (2160, 3840, 3) indicates the size of the image (height, width, RGB). Subsequently, the numpy array (only partial output displayed) shows the representation of the image as a 3D matrix.
(2160, 3840, 3)

[[[ 43  47  58]
  [ 51  55  66]
  [ 50  54  65]
  ...
  [145 131 130]
  [150 136 135]
  [150 136 135]]
Reading in data – JSON (JavaScript Object Notation)
JSON is a semi-structured data format that allows the description of more complex data structures beyond a simple table. As an example, imagine I have an arbitrary JSON structure that represents the state of my front door light.
FrontDoorLight.json
{
	"FrontDoorLight": {
		"on": true,
		"bri": 254,
		"hue": 8418,
		"sat": 130.50,
		"effect": "none",
		"xy": [
			0.4573,
			0.41
		]
	}
}
As can be seen my light has several properties such as its’ on/off state. With the “on” field being “true”, evidently my front door light is turned on. On the other hand, we can see additional properties including it’s brightness (bri) or hue, etc.
Using Python’s built in json package, we can first import the package, and then read the data from our json file using the “with open” statement. The command “json.loads” helps to read in the data structure and stores it into a variable “mydata”
import json

# read file
with open('FrontDoorLight.json', 'r') as jsonfile:
    myjson = jsonfile.read()

# parse file
mydata = json.loads(myjson)

# Prints the entire JSON
print(mydata)

# Prints the node "FrontDoorLight"
print(mydata['FrontDoorLight'])

# Prints the node "FrontDoorLight" --> "On"
print(mydata['FrontDoorLight']['on'])
Based on the code above, we get the following output:
{'FrontDoorLight': {'on': True, 'bri': 254, 'hue': 8418, 'sat': 130.5, 'effect': 'none', 'xy': [0.4573, 0.41]}}
{'on': True, 'bri': 254, 'hue': 8418, 'sat': 130.5, 'effect': 'none', 'xy': [0.4573, 0.41]}
True
Summary
To summarise, we have went over different ways to read a variety of data formats. At first, we looked at how to work with structured data such as comma separated values and Excel. Straightaway we looked into how images work in Python. Lastly, we took a brief look into a semi-structured data format – JSON.
 | About Alan Wong… Alan is a part time Digital enthusiast and full time innovator who believes in freedom for all via Digital Transformation. 兼職人工智能愛好者,全職企業家利用數碼科技釋放潛能與自由。 |

